Accessing your Octopus smart meter data
In this post (originally published on Medium) I show how any customer of Octopus Energy with a smart meter can see their energy data and do a bunch of stuff like calculating bills and emissions, comparing tariffs and understanding their usage profile.
Having a smart meter promises easy and reliable access to your smart meter data. The reality is more disappointing: an in-home display that is limited and hard to make sense of, or whatever your charts and tables your supplier decides to offer. And, if you ever don’t trust the numbers they do give you, there is no way to dig into them.
Octopus at least lets you access your data in clever ways via an API, but that’s beyond the capabilities of most customers. Still, it has created a space for developers to create some pretty cool apps and tools. If you are on Octopus’s Agile tariff (in which the price varies every half hour) I’d definitely recommend you get one of Octopus Energy Watchdog (for ios) and Octopus Watch (for ios and android). But if you’re just a normal customer, who occasionally wants to check how much electricity or gas you’ve used and how much it has cost, what do you do?
I have therefore built a website that lets any Octopus customer with a smart meter pull in their consumption data and do various things: charting your consumption, cost and emissions over time, reconciling bills, understanding your usage profile and how the cost would vary under different types of tariffs, and saving your consumption and price data as a csv file so you can open it up in Excel or another program. It is free to use, and the code is available to anyone who wants to review it.
Ultimately there is no reason why customers with other suppliers can’t use the site, I already have some others who are using it via n3rgy.com. But for the rest of this post I will assume you are an Octopus customer.
Getting Started
To get started you need to have two pieces of information: your Octopus account number and a security key.
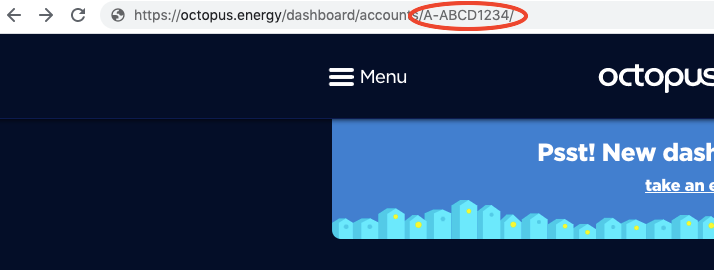
The Octopus account number is a code like A-ABCD1234. You can find it at the top of your latest bill. Or if you log into your account and going to the dashboard, it is part of the URL:
The security key is a 32 character string , something like sk_live_aa25asdf234sdf345sdf. If you go to the developer dashboard , it will either tell you what yours already is, or let you create one. Be very careful with your security key, and don’t share it — as this blog post shows, anyone with your account number and security key can see your electricity consumption history. You can change your security key at any time on the developer dashboard, which is worth doing regularly, especially if you think anyone has access to it who shouldn’t.
Once you have your account number and security key, go to https://energy.guylipman.com/sm/admin?source=octopus and enter your account number followed by your security key (all one long string, eg A-ABCD1234sk_live_aa25asdf234sdf345sdf). Note that the website won’t store your account number or security key.
The Admin Page
Once you enter your account number and security key, it will show you what information Octopus have:
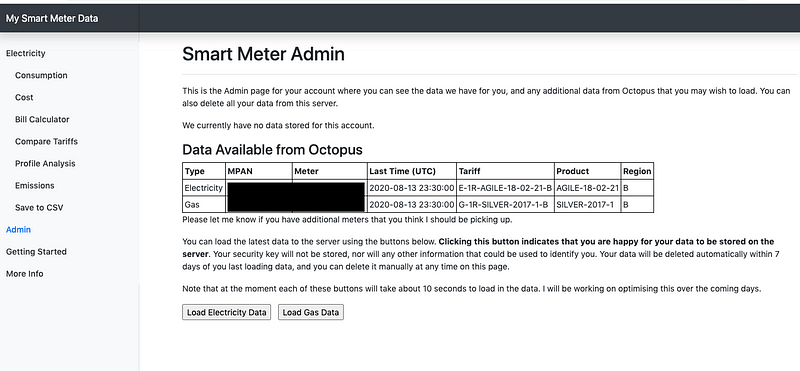
This should include a row for electricity consumption, and may also include rows for gas consumption and electricity export if you have these. The table will show you the last time period for which Octopus have data available. If it doesn’t return any data, you may have entered the wrong account number or security key. It also shows you your tariff product and region code, which you may need to know in future steps.
If you want to look at your data, you will have to load it. When you load it, it stores all your data going back as far as January 2019 in a database table. It doesn’t store your identity or your account number / security key. You can then access that data through your browser for an hour (or you can delete it manually at any point).
For now just load your electricity data. When you click the button, it will take about 10 seconds to load, at which point it should show you that the data has been loaded. It also shows a button to delete the data (if you don’t, it will be deleted within a few hours anyway, to clear space for more users’ data).
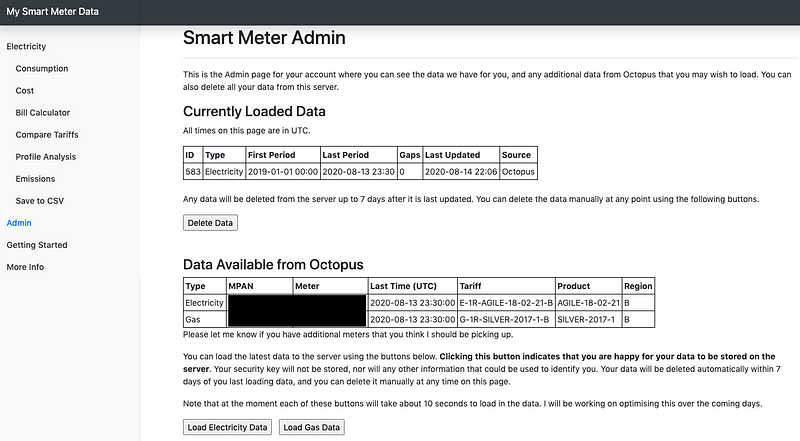
The table at the top shows the first and last periods for which it has been able to retrieve data. It also identifies if there are any gaps between that period, if so they will be shown at the bottom of the page. If there are missing periods it will affect the accuracy of any calculations the website makes. All times on this page are in UTC/GMT.
Once you have loaded the electricity data, you will be able to start looking at the data.
Consumption Charts
If you click on Consumption on the menu, under Electricity, it will take you to the following page:
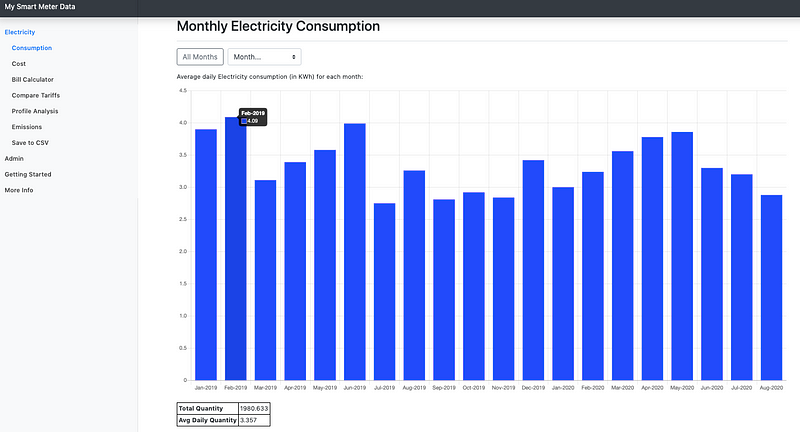
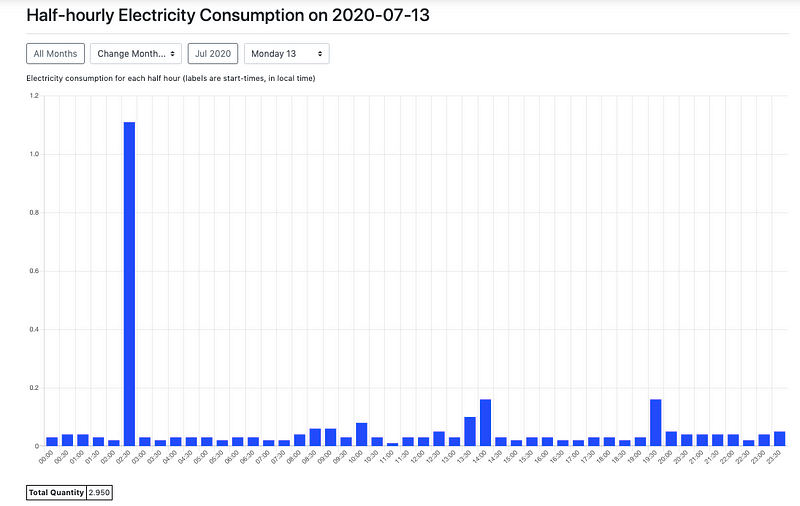
This shows you a chart of your monthly electricity consumption, in kwh, with a table at the bottom. You can drill down by month and day, for example, here is the half-hourly consumption for 13 July 2020:
Cost Charts
If you click on ‘Cost’ under Electricity on the side bar, it will take you to the cost page, where you can see charts of monthly, daily and half-hourly cost (in £ per period). In order to do this, the website needs to know your tariff:
- If you are on a flat tariff this is easy, you just add an extra parameter at the end of the URL: &tariff=15 (replace 15 with whatever your tariff is, including VAT).
- If you are on a economy 7 type deal, you’ll need to add an extra parameter at the end of the URL: &tariff=0000–0800:9.681,15.8445
This essentially means that from midnight to 8am the price is 9.681p/kwh, and the rest of the time your price is 15.8445. Replace these prices with your tariffs, including VAT. - If you are on one of the Octopus special tariffs like AGILE-18–02–21 or GO-18–06–12, you will need to add two parameters, for example: &tariff=AGILE-18–02–21®ion=C
The tariff is referred to as the product on the Admin page, where you can also see your region code.
There is nothing stopping you entering a tariff other than your one, if you want to see how much your consumption would have cost on another tariff.
Once you enter this tariff in the url (see the example below), you will see something like:
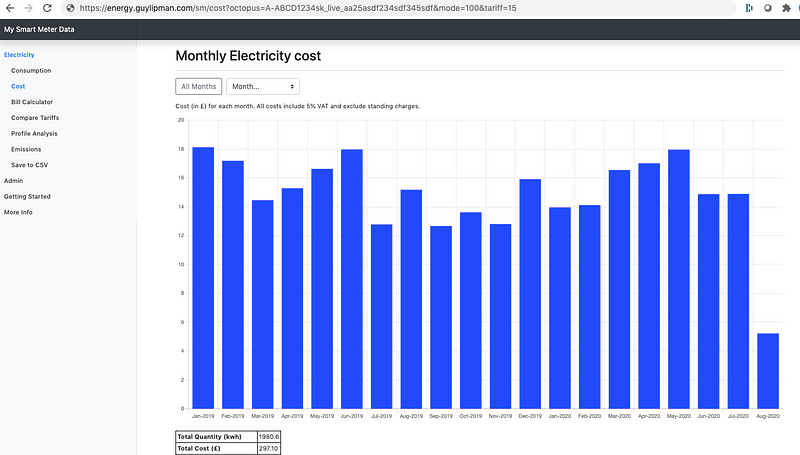
Just as with the consumption charts, there is a table of numbers below the chart. You can also drill down into individual months and days using the dropdowns at the top of the page (and go back to the monthly view).
Bill Calculator
The Bill Calculator allows you to recalculate your bill for a particular period, in order to reconcile the bill you’ve received from Octopus. Enter your tariff details (including the standing charge) and the bill start and end date, and click calculate.
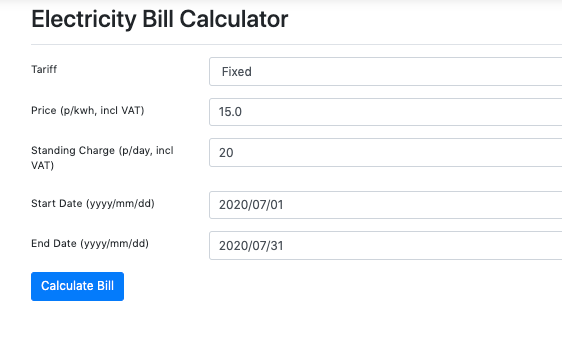
It then generates a bill calculation. It shows it in two different ways: firstly with VAT added at the end, and secondly with VAT included in each component. The two calculations come to the same total.

The bill calculation won’t necessarily be exact: Octopus apply rounding in various places, while I only round to the nearest pence at the last stage. This can lead to my total consumption being as much as 1kwh out from the bill, and the cost being around 10p out. If you are out by more than that, it is worth looking into it.
Save to CSV
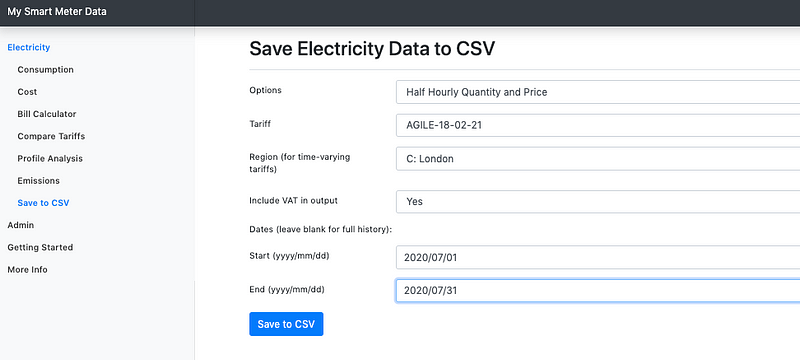
While the website has lots of features, you may want to perform your own analysis in Excel or some other program. To do this, click Save to CSV on the side bar. You can choose between Half Hourly Quantity, Price or Quantity and Price, as well as Daily Quantity, Quantity and Cost, or Price. (Note that price is measured in p/kwh, while cost is measured in p or £). Depending on your choice of options, it may ask you for tariff details, and it will ask for a start and end date. When you click ‘Save to CSV’ it should save a file with comma separated values which you can open in another programme.
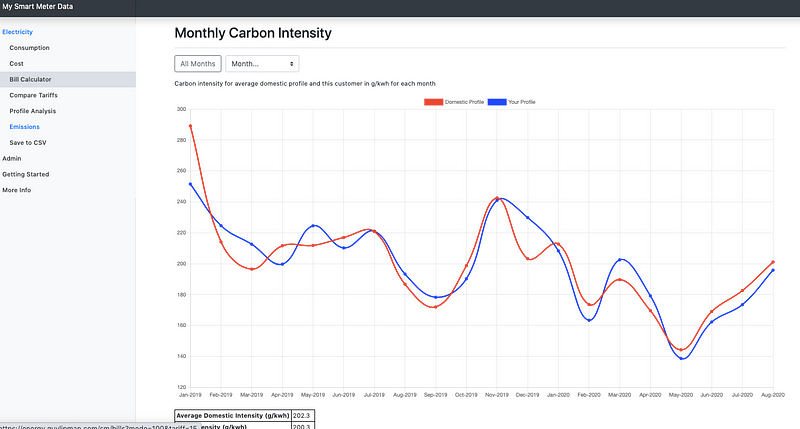
Emissions
National Grid publish an estimate of the carbon intensity of electricity each half hour, and some customers try to actively reduce their carbon footprint by shifting their consumption to times they expect will have lower carbon intensity. I have mixed feelings about the meaningfulness of these numbers, as they report average intensity rather than the marginal intensity if you switch on or off your kettle. However, even if they aren’t exactly right, I think considering the carbon intensity of your consumption does a lot more good than harm, so I have included it as a function of the website.
For the monthly and daily charts, it plots the average carbon intensity (in g/kwh) of your consumption in blue. It then plots in red the average carbon intensity of the average domestic customer (using what is known the deemed profile coefficients). In the tables below it also shows your emissions over each period.
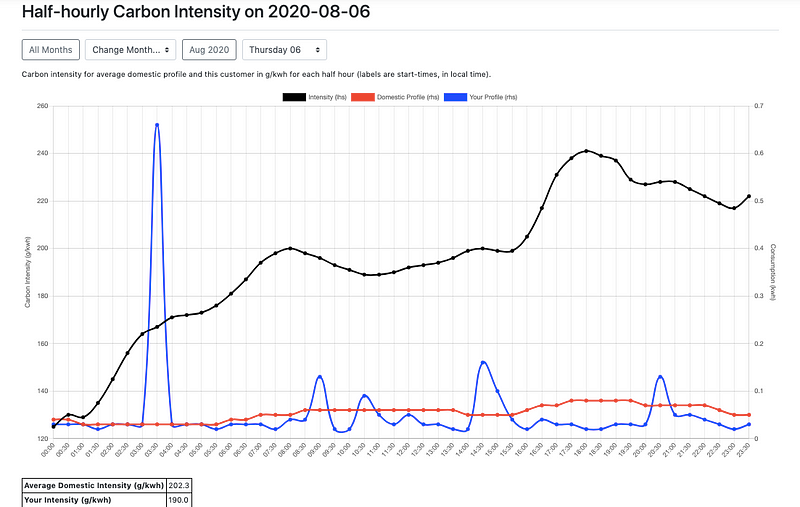
If you drill down to half-hourly level, the chart appears differently, as the half-hourly carbon intensity (in g/kwh) is the same for both your profile and the average domestic customer, so is shown in black. I show your consumption profile (in kwh for each half hour) in blue alongside the average consumption profile (in kwh for each half hour) in red.
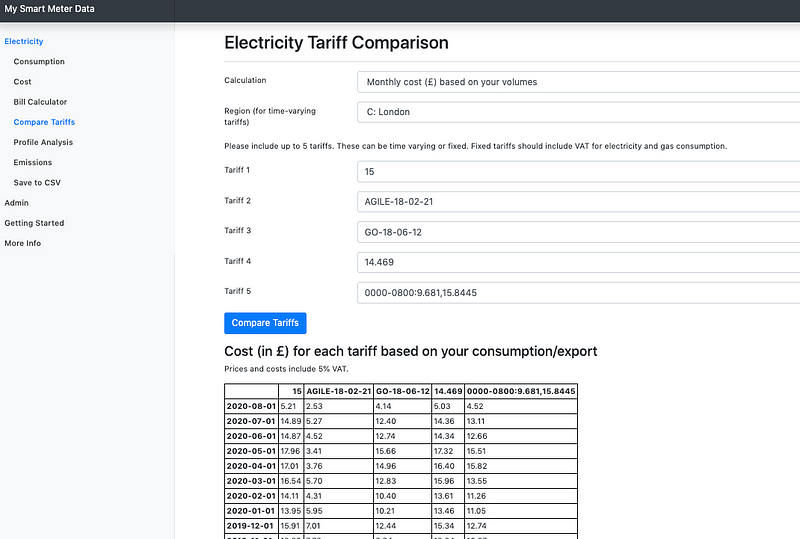
Compare Tariffs
There are various tariff comparison sites out there, however none of the ones I’m aware of look at your half hourly consumption profile to get a sense of whether you might be better on an economy 7 or time of use tariff. As a result, I’ve included the ability to see what the cost (in £) or price (in p/kwh) for each month would have been for up to 5 tariffs, given your consumption profile. Note that for flat or economy7 time tariffs, you will need to enter the relevant prices.
Profile Analysis
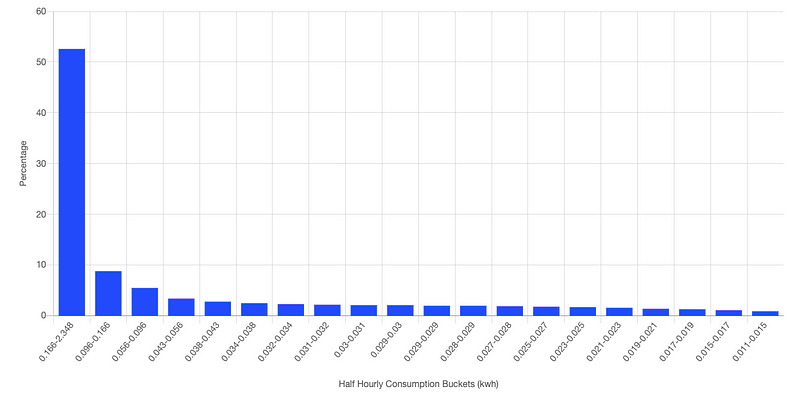
The final feature I have created for electricity consumption is an analysis of your consumption profile. I wanted to be able to tell customers a bit about how their consumption varied across the day and across the year, and any implications for potential cost savings. This is still a work in progress, but I hope people find it of interest.
The first chart shows what proportion of your overall consumption occurred in the 5% of periods with most consumption, the next 5% of periods, and so on until the 5% of periods with least consumption. So, in the chart below, I can see that 53% of my consumption occurs in the 5% of half hours with between 0.166kwh and 2.348kwh.
The next chart shows how your average profile (in blue) varies from the average domestic customers (red). We can see here that I tended to use much more electricity in the early hours of the morning, and considerably less from 4–8pm. The black line shows the Octopus Agile price for each half hour, which I consider represents a good estimate for how much electricity really costs in each half hour, on average.
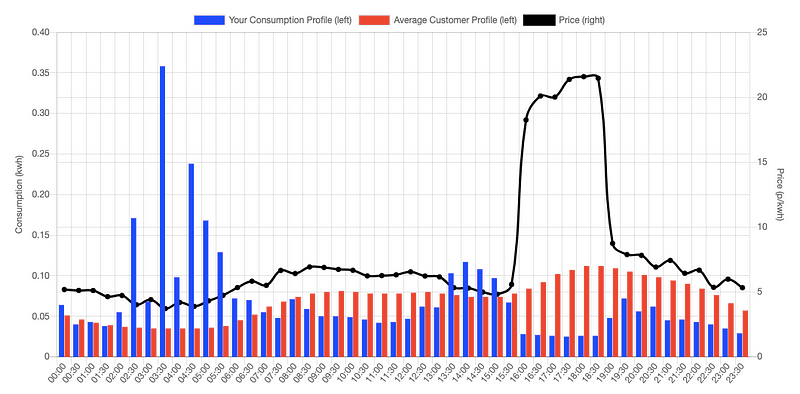
If you are a customer on Octopus Agile tariff, you will care about this price a lot. However, even if you are not, I believe you should care. If you are using less electricity at the expensive times of the day (relative to the average customer profile), you are basically subsiding those that use more at the expensive times of the day, and it might make sense for you to consider switching to Agile. If you are using more electricity at the expensive times of the day, then you are being subsidised, and over the longer term you should probably expect your costs to go up more than for other customers. This isn’t to say you are doing anything wrong — after all, you may have young children that need to eat dinner at 5pm. But I do believe the market is going to become more aware of how the price of electricity varies over the day.
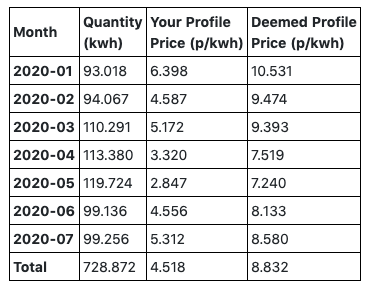
The final table on this report shows, for individual months, what the price of your profile was, compared to the average customer deemed profile. If your profile is consistently cheaper than the deemed profile, you probably consider switching to a time of use tariff.
Gas Consumption
All the sections above have been specific to electricity consumption. However, if Octopus have your gas consumption data, you can load this and perform very similar functions. A few differences worth noting:
- If your meter is SMETS1, it naturally shows consumption in kwh. However, the conversion factor used by your meter may not be exactly as that applied in your bill. As a result, your bills may be out by around a percent from that calculated by Octopus.
- If your meter is SMETS2, the gas consumption data is in cubic metres. You will need to apply a conversion in order to get the correct result. You can do this by including a parameter in the url: &gasmult=11.19. This conversion includes a volume correction factor (of around 1.02264), a calorific value (around 40), and a kwh to J conversion of 3.6.
- To get the cost results, you need to add &gastariff=3 to the URL (in p/kwh, including VAT), or &gastariff=SILVER-2017–1®ion=B
Note that you can simultaneously include a &tariff and a &gastariff in the URL: the tariff gets used for electricity consumption and the gastariff for gas consumption. - If you are on gastariff SILVER-2017–1 (also known as Gas Tracker), they sometimes take your monthly consumption, and use a model to estimate what your consumption would have been on different days. The good news is it seldom has a big impact, but if your bill calculation is a few percent out from your bill, this may explain the difference.
Electricity Export
If you have electricity export from your smart meter, you can also load this. Most of it behaves similarly, except Consumption and Cost are referred to as Export Quantities and Revenue. Also, there is no VAT applied to export, and no standing charges.
Concluding Comments
I hope you find the website to be a useful way of engaging with your smart meter data. If you have questions, or suggestions, please do pass them on, either as a comment on the Medium post, by email, or on twitter on @GuyLipman. The website may occasionally be unavailable, or produce wrong numbers, and I won’t necessarily be able to fix things straight away. But I’ll do my best — and I hope you’ll appreciate that this is a hobby project of mine to make it easier for customers to engage with their energy consumption.